MegaLogViewer HD HistogramsPicture being able to select any field for your X, Y and Z axis and instantly have a table generated with statisics on the data! Generate a table of spark timing, VE Values, AFR, AFR Error or any other combination you can dream up. Then dive deeper in to that data by applying filters that may remove unwanted data or help explain what inputs are behind the table. Filters can be clicked on and off with a near instant rerendering. Turn on a 2nd Z axist for comparing the delta between fields such as Actual AFR and Target AFR. See exactly how far off every cell of you fuel table is by processing all the data in your logs. You can plot your spark or AFR table, see where in on the maps knock is occuring. The uses are endless and limited only by the data in your logs. Using a typical log of about 8900 records these Histograms are generated. The X & Y Axis are full customizable, generate any size tables as needed to match your system and use filters to discard outlying data. Shock deflectionA 2D Histogram of Shock deflection displayed as a Bargraph as opposed to table of cells. 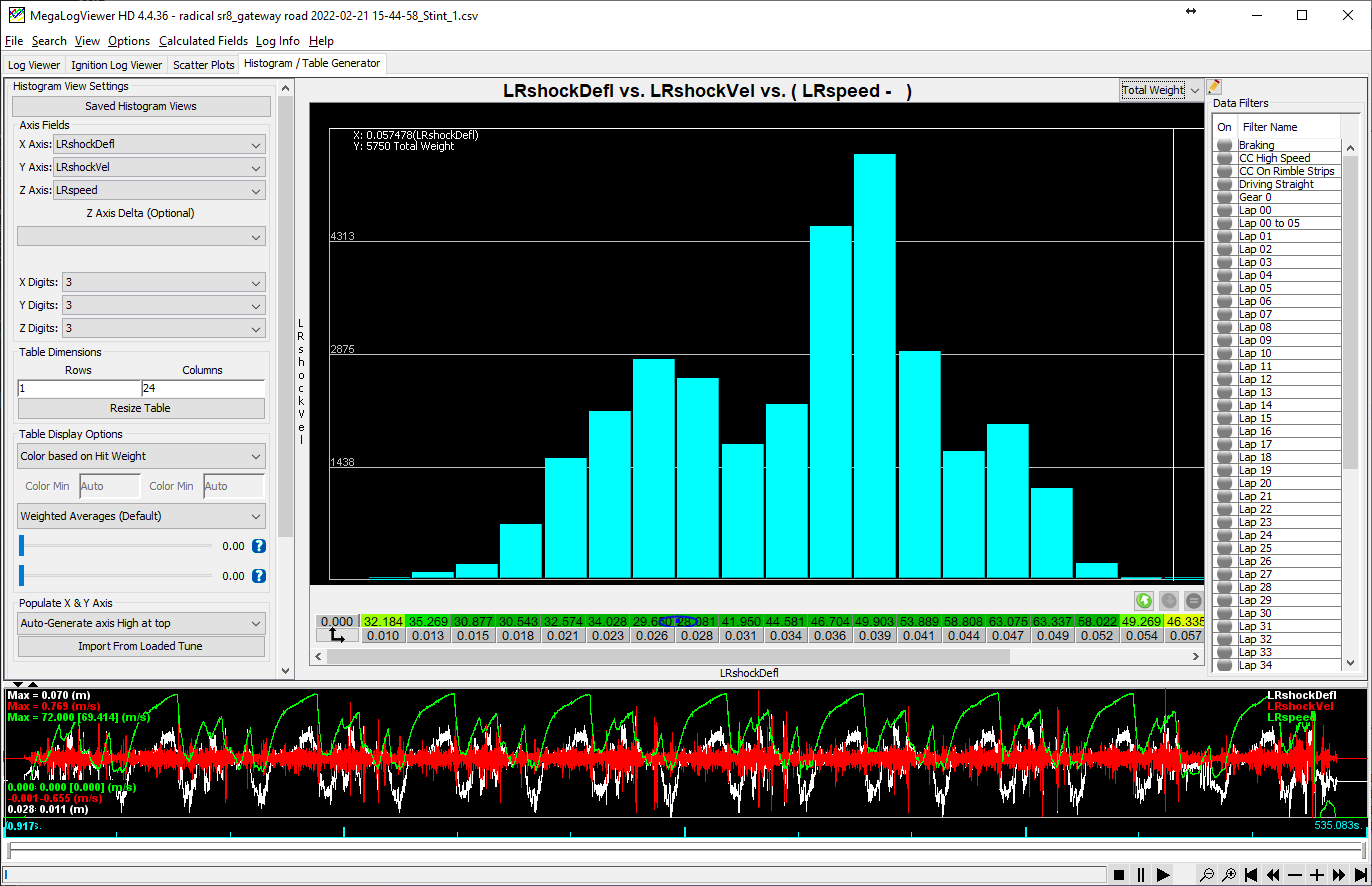
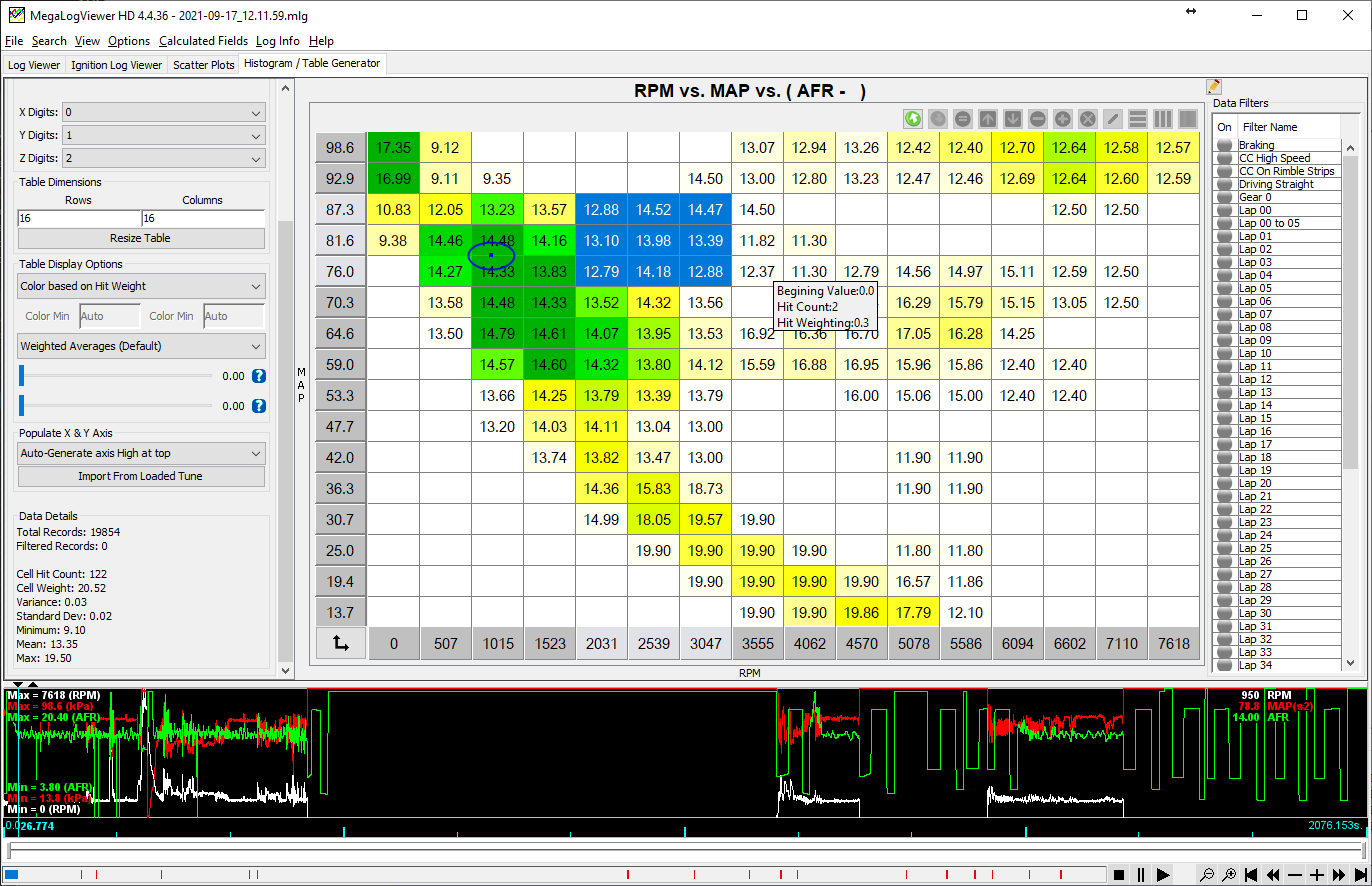
RPM vs. MAP vs. AFRA Histogram that shows what AFR the engine was running at in each of the cells on the table.
RPM vs. MAP vs. (AFR - AFR Target)Taking that step further, with a log including target AFR, you can set that up as a Z delta field.
With a Z Delta Field, then the generated table shows the difference between the Z field and the Z delta,
in this case that means a table that represents how far off your engine was running from the target AFR in each cell. 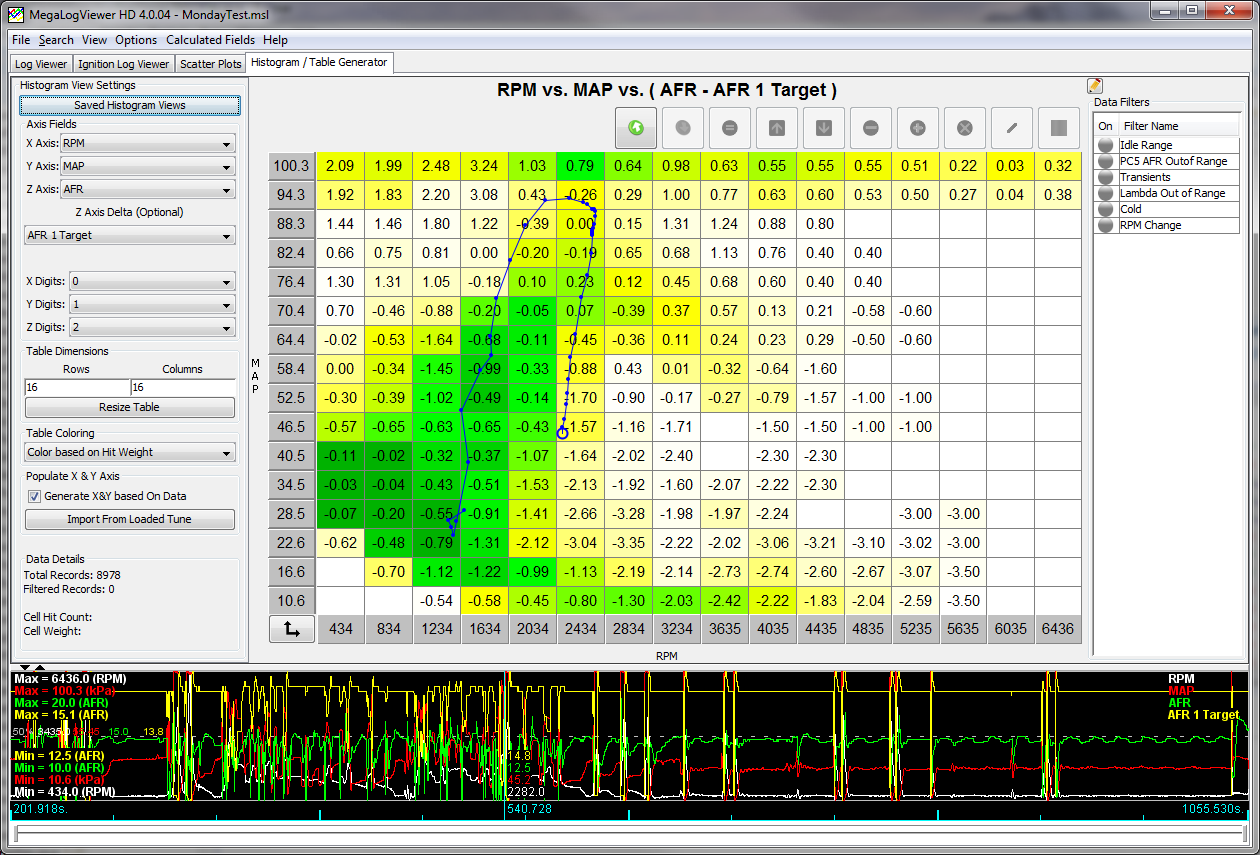
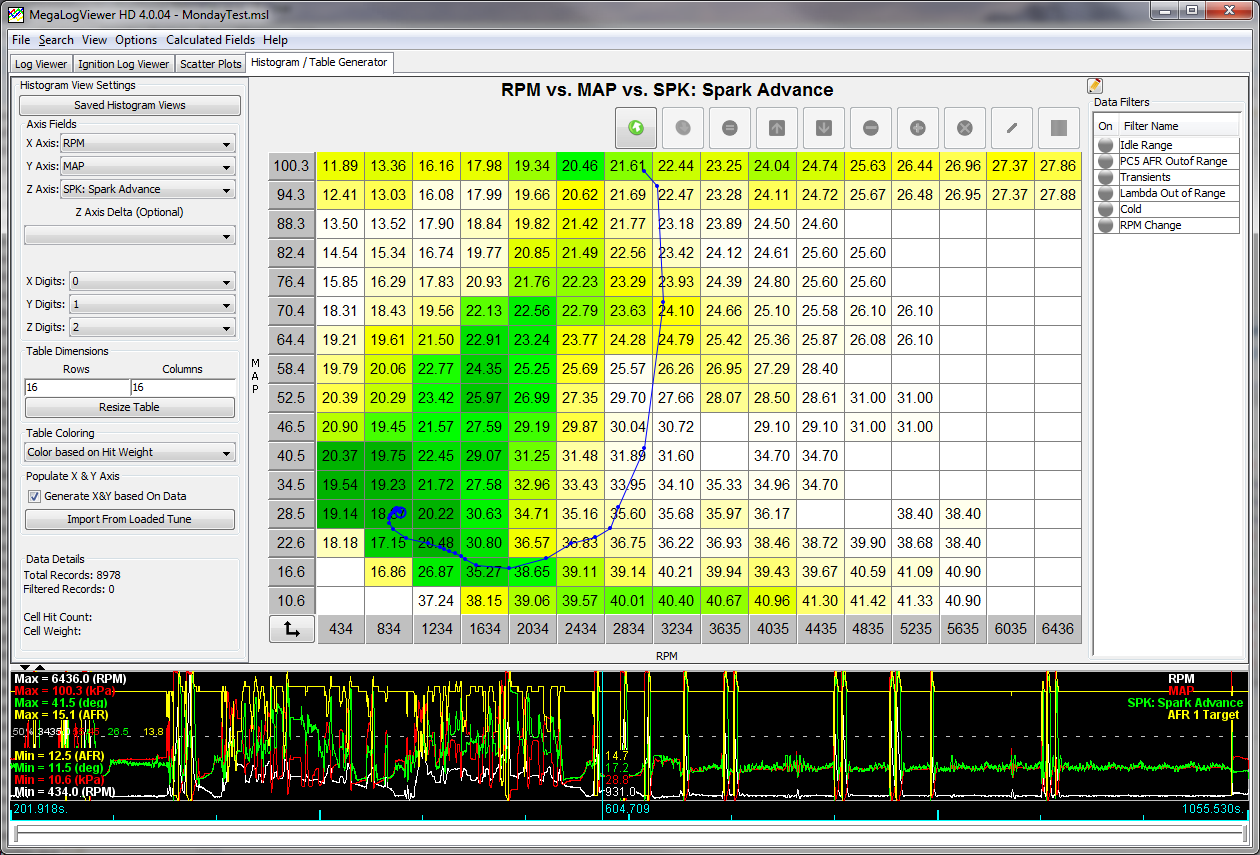
RPM vs. MAP vs. Spark AdvA quick simple view to show how quickly you can see exactly what spark timing the engine is running at in each cell.
|